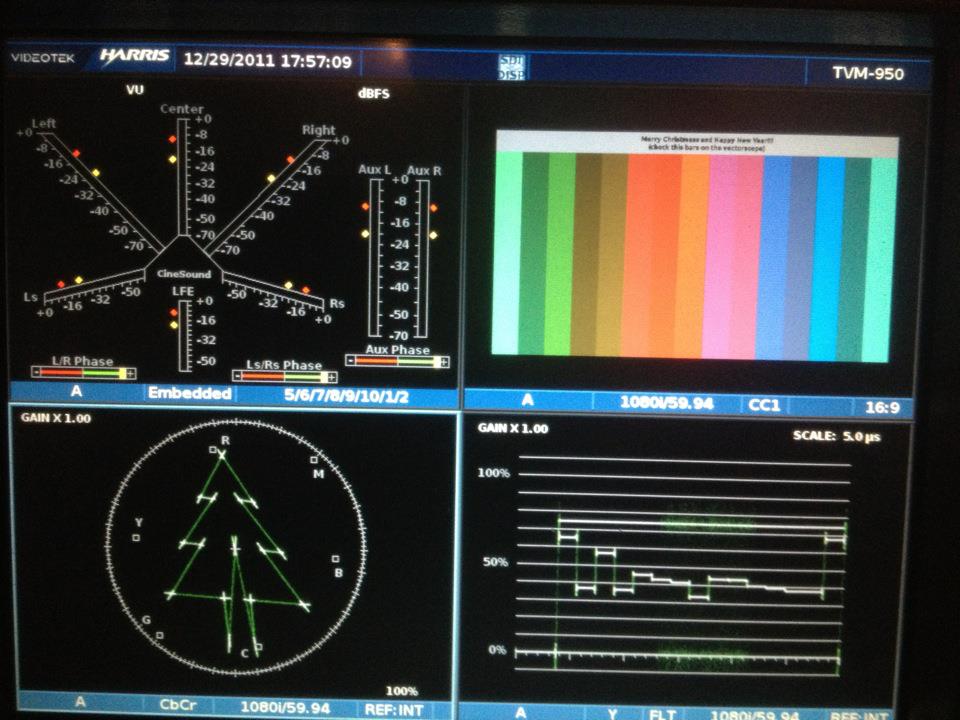
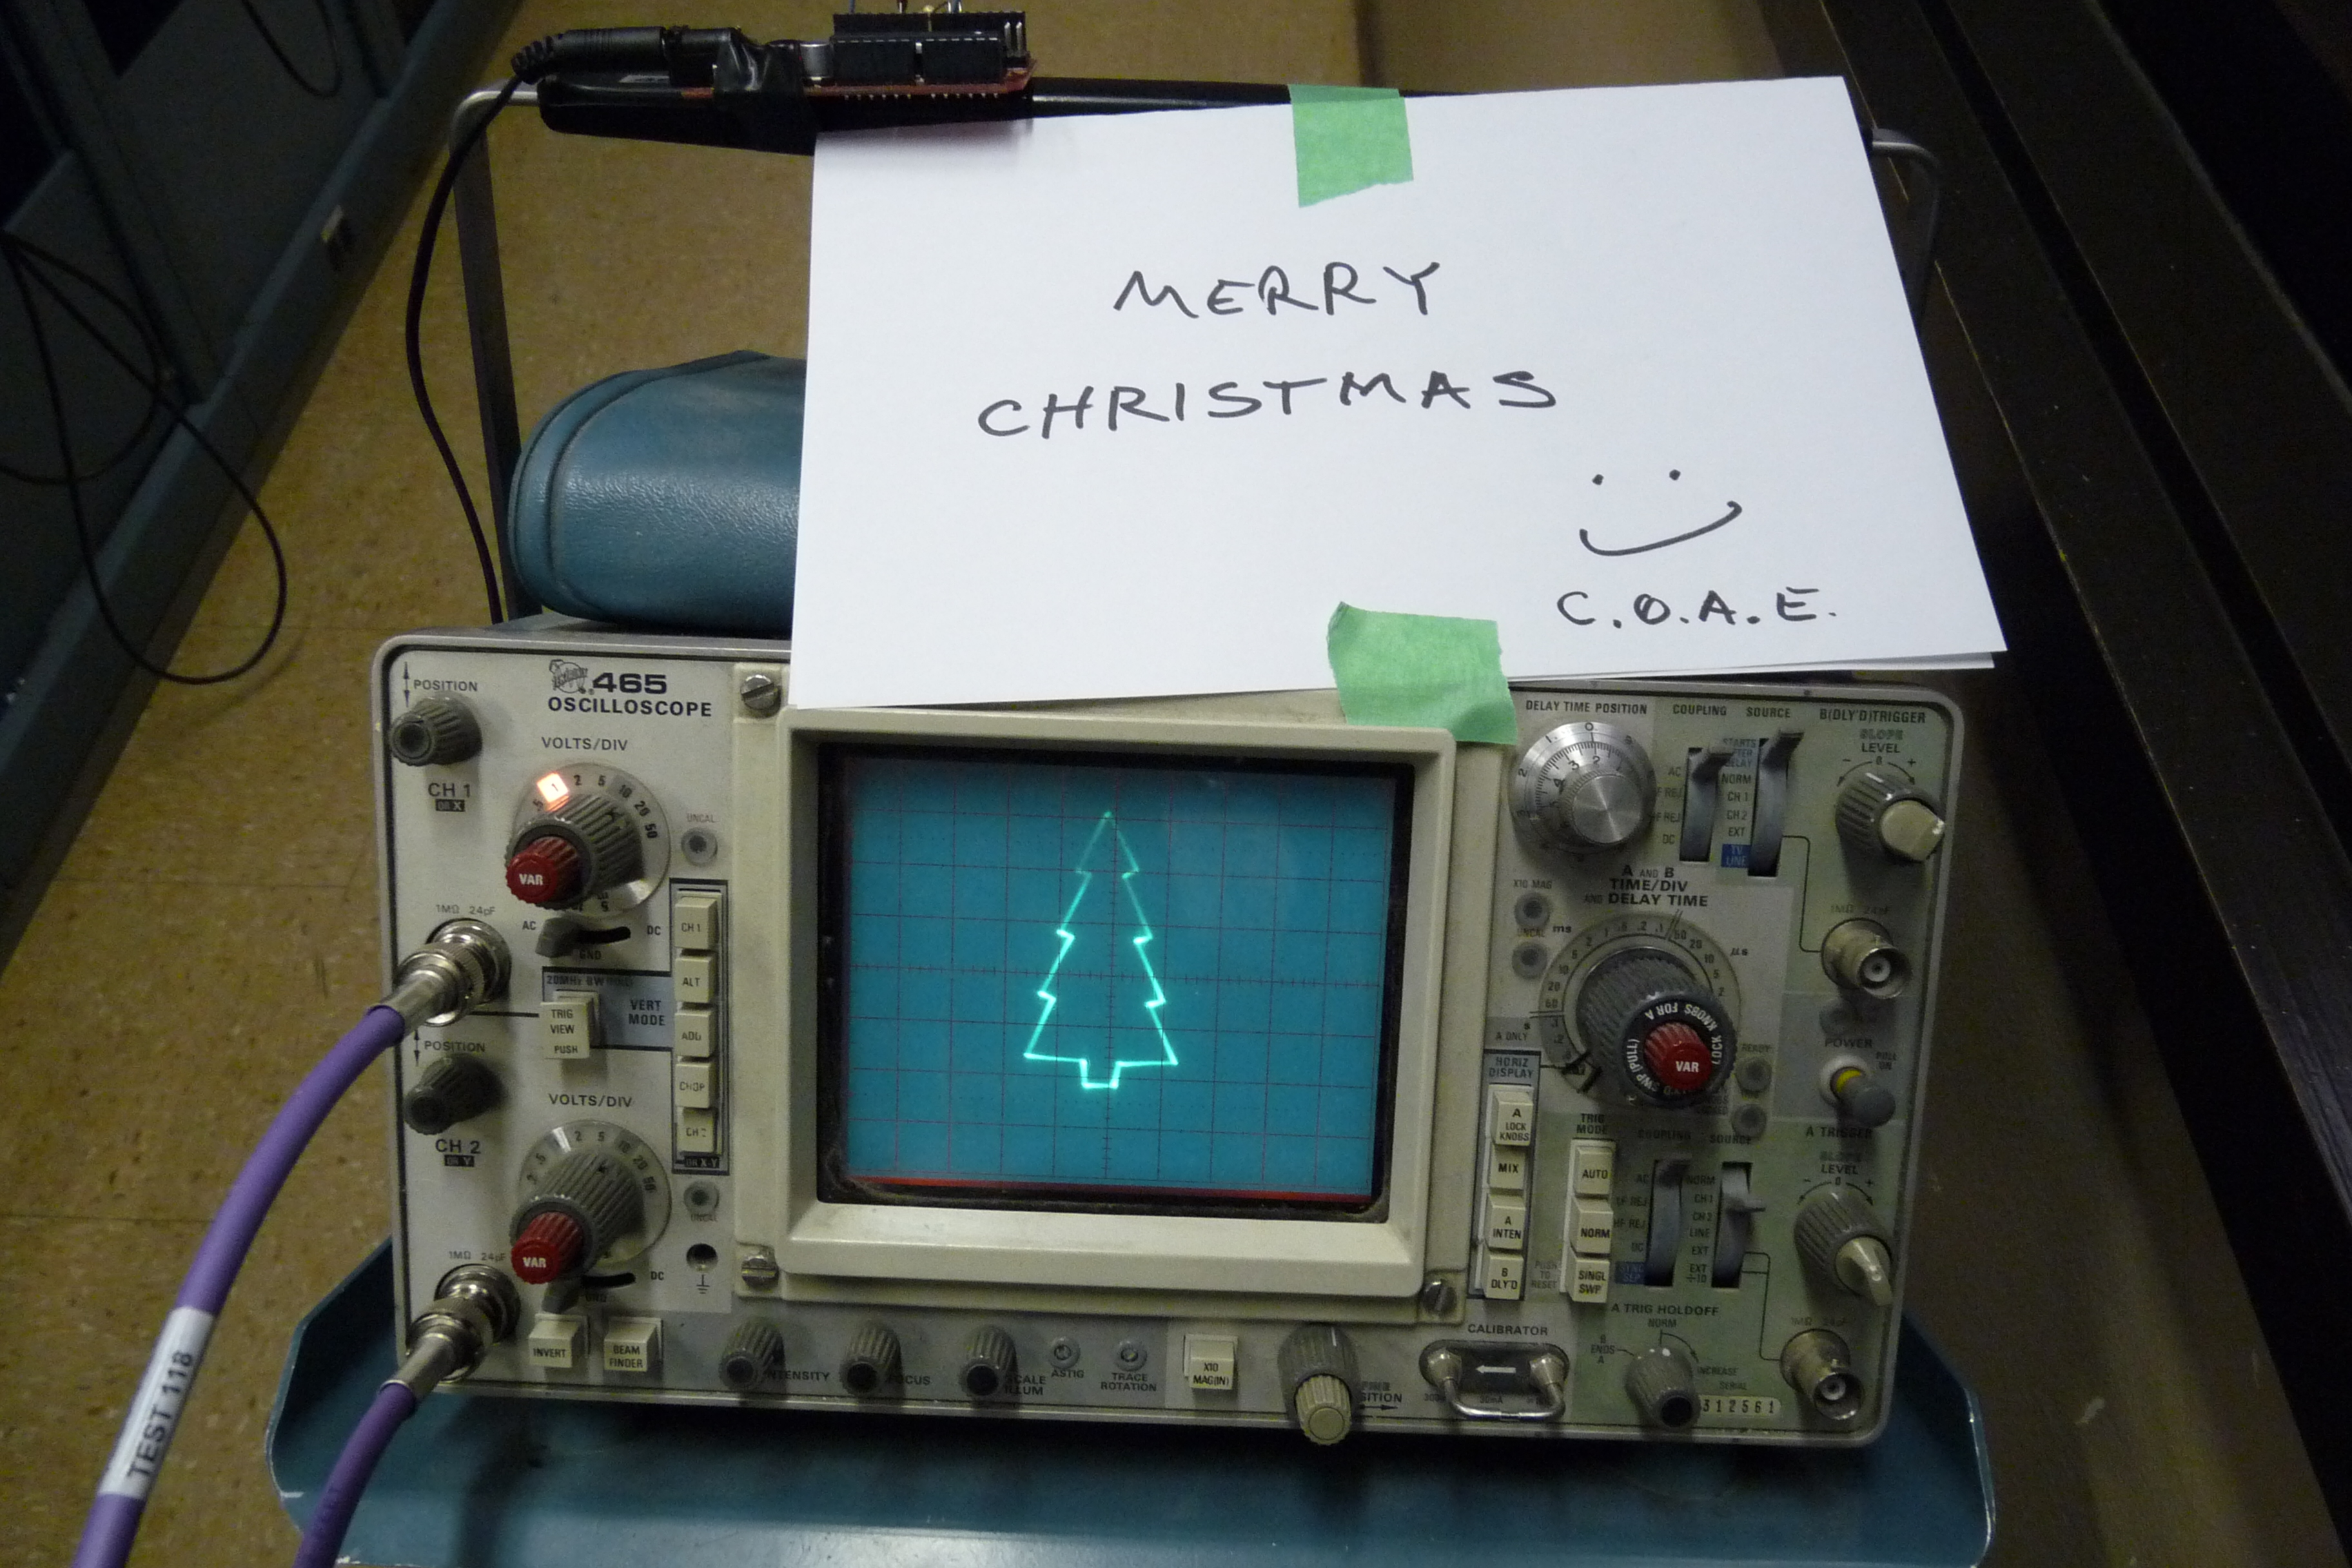
OK, here’s another take on drawing the Christmas tree on electronic screen – this time using “specially designed colour bars” 🙂 and here’s the result viewed on the vectorscope:
How’s the tree created? I was using Charles Poynton’s book “Digital Video and HDTV” (thanks, Charles!) and formula for calculating RGB colour from YCbCr. Here’s the formula, just to scare you off:

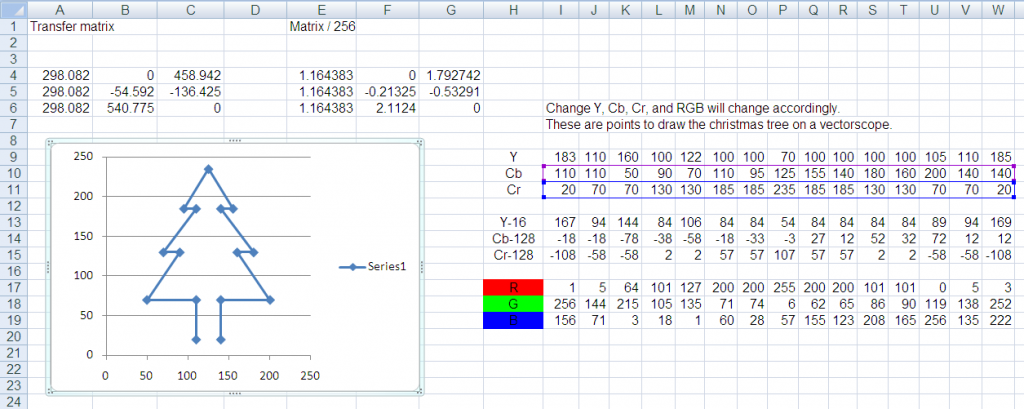
So, tree was plotted on the X-Y coordinate system, where Cb is on a X axis, and Cr is on a Y axis. Because it involves a lot of calculations, spreadsheet was used. After all, we live in a 21st century, right? Spreadsheet helped a lot with playing with Y values, to keep RGB between 0 and 255. Here’s the screenshot of the spreadsheet:
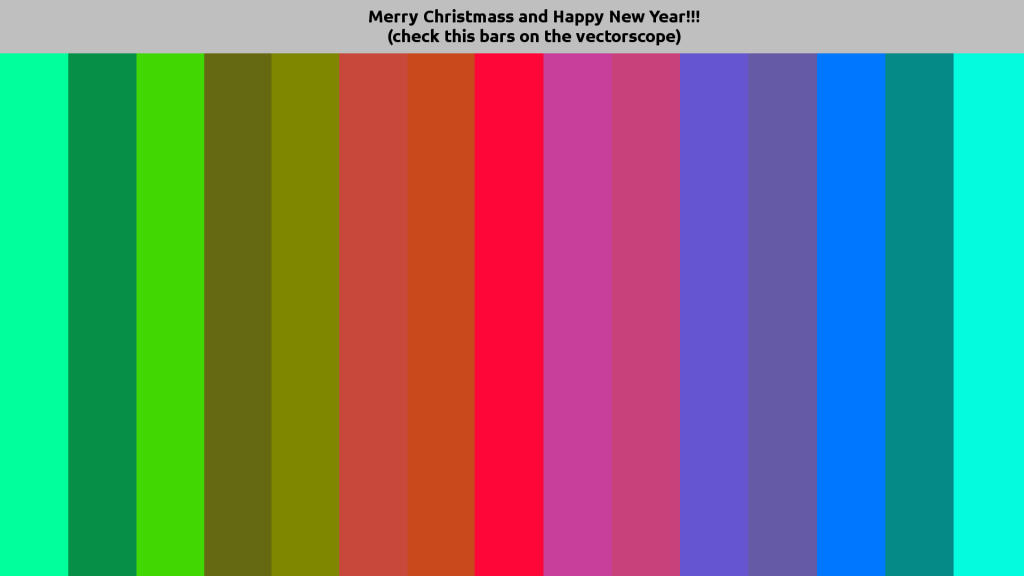
Finally, here’s the original picture that was converted to the HD video and fed to the Harris rasterizer (vectorscope, waveform monitor, etc) that you can see on the first picture:
As you can see on the first picture, tree is little bit slanted towards RED. I still have to figure out why is that? Since I don’t have the equipment at home to adjust the bars, picture was created just by doing calculations and brought to the station for the first try. Well, I think it’s not bad for the first shot.
Here’s some more pics of my colleagues trying to get picture of the tree:
